The smart chart, engineered from research.
CandleView reads the chart for you. Its own analytics engine, built on more than 280 logged research observations, marks the structure, ranges and zones that matter, the same way on every market from 5 minutes to daily. You see the picture straight away instead of drawing it.
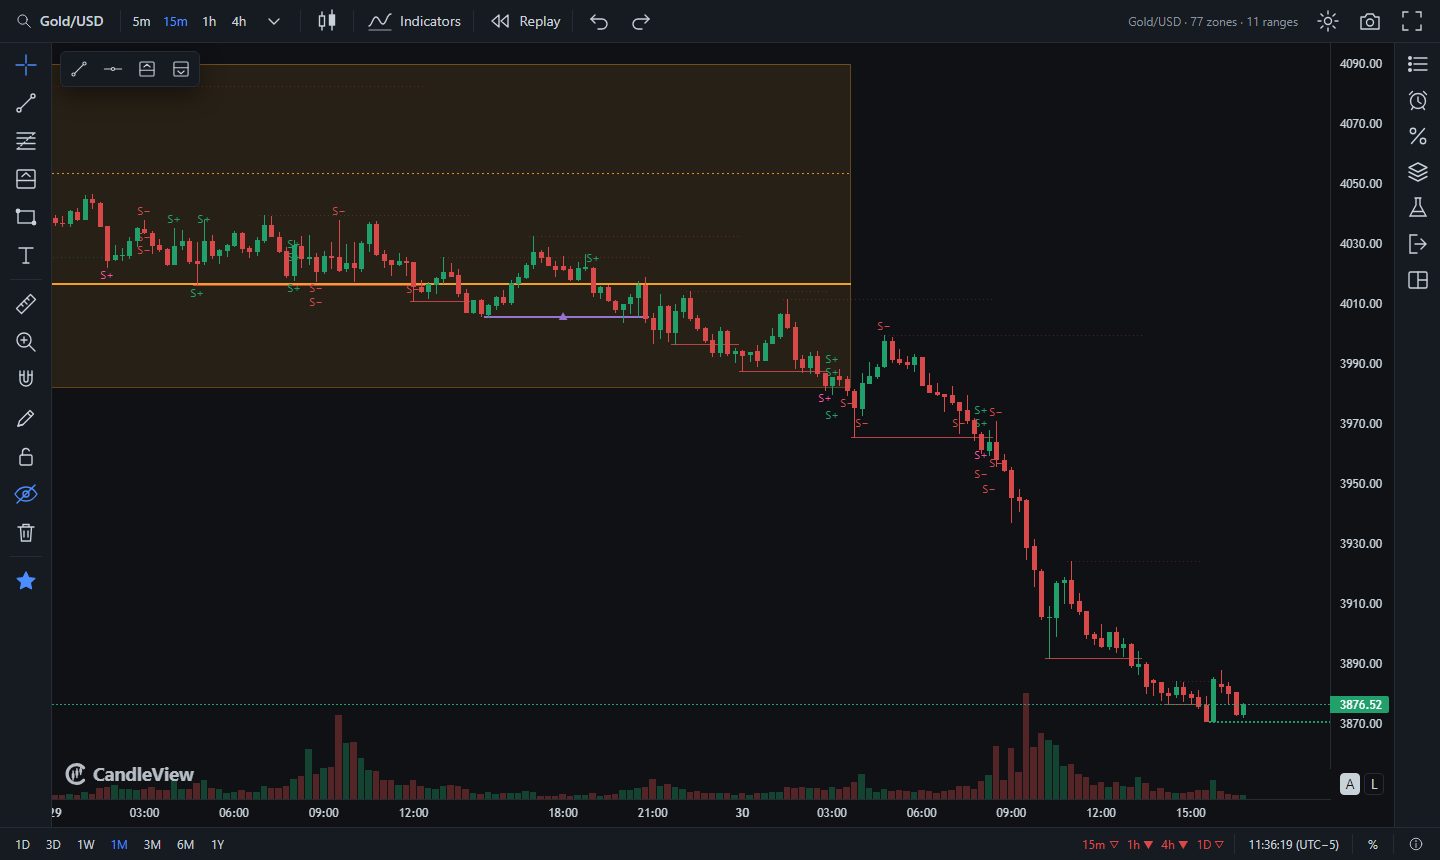
The smart chart
What it reads for you
Four layers from one engine, read the same way on every market and timeframe, so a chart means the same thing whoever opens it. Marks are colours and symbols only: a clean chart, no clutter, no text.
Dealing ranges
The range that matters right now, mapped on the candles it covers, with its premium and discount halves. The higher timeframes share the chart, each with its own mark.
Market structure
Breaks of structure and changes of character as they happen, and the trend on 15 minutes, 1 hour, 4 hours and daily, side by side.
Zones in context
Supply and demand zones, sorted by the engine: the ones in play are shown, the rest stay quiet. Live and ended zones, each on a switch.
Fair value
Point of control, value area and anchored VWAP, shown when they are relevant and silent when they are not.
Replay without repaint
Practise on the past exactly as it happened
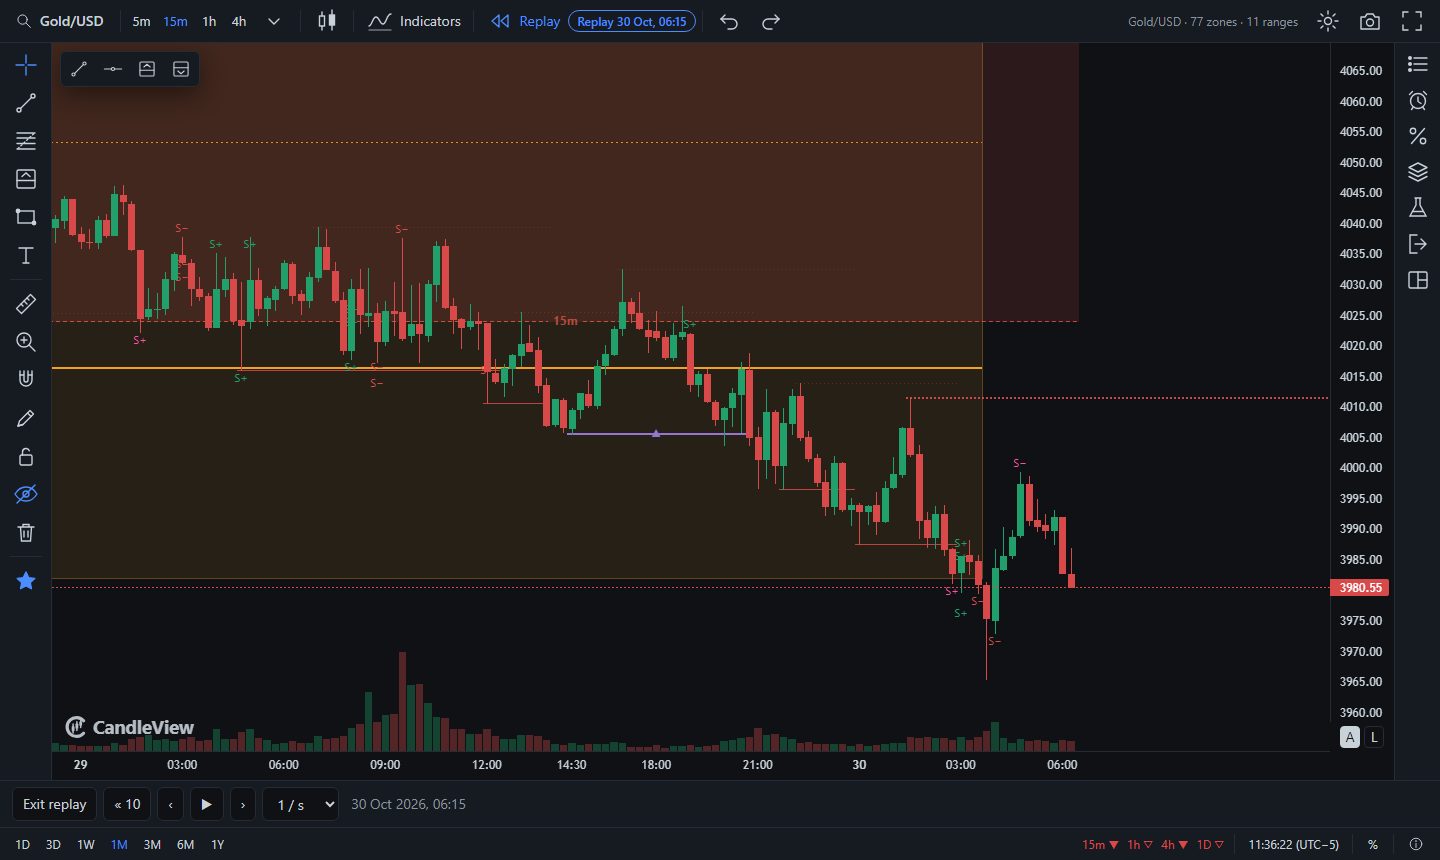
Step candle by candle through any day of the last year. Every mark is what the chart knew at that moment, never what hindsight drew later, and the forming candle is shown as it stood.
- Step, play and jump back to build screen time fast
- Several timeframes in one synced replay
- No future leaks into the past
Alerts on your phone
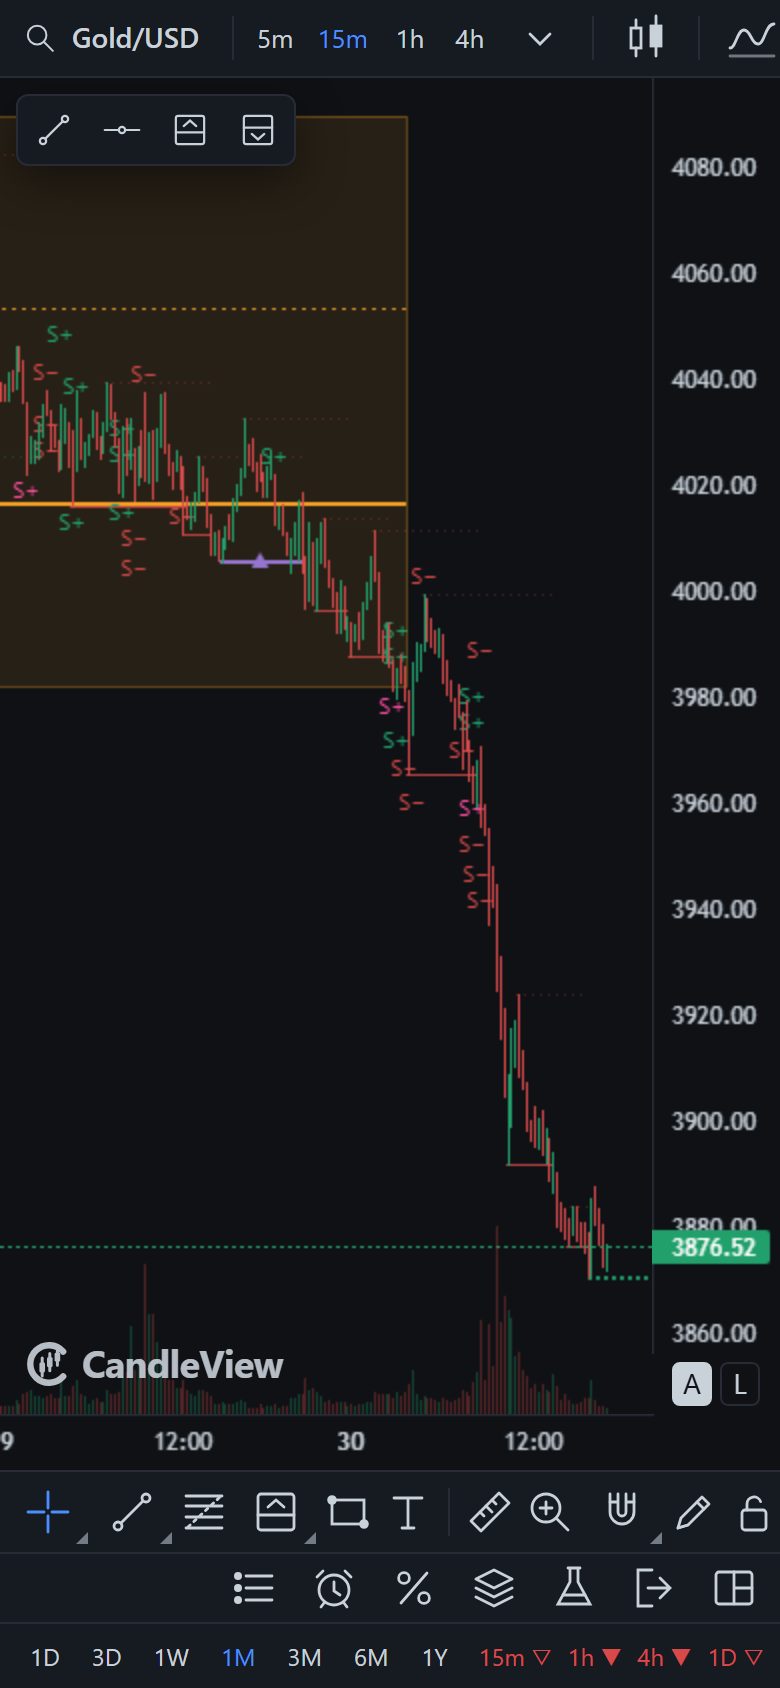
Know when structure moves, even with the app closed
Set an alert on any market and timeframe: price reaches a zone, structure breaks, or price reaches your level. CandleView watches for you and sends a push notification to your phone or desktop.
- Alerts say what structure did, never what to trade
- Quiet hours, and nothing sent late after a pause
- Tap an alert to open the chart at that moment
An honest strategy tester
Know if a rule has an edge before you trade it
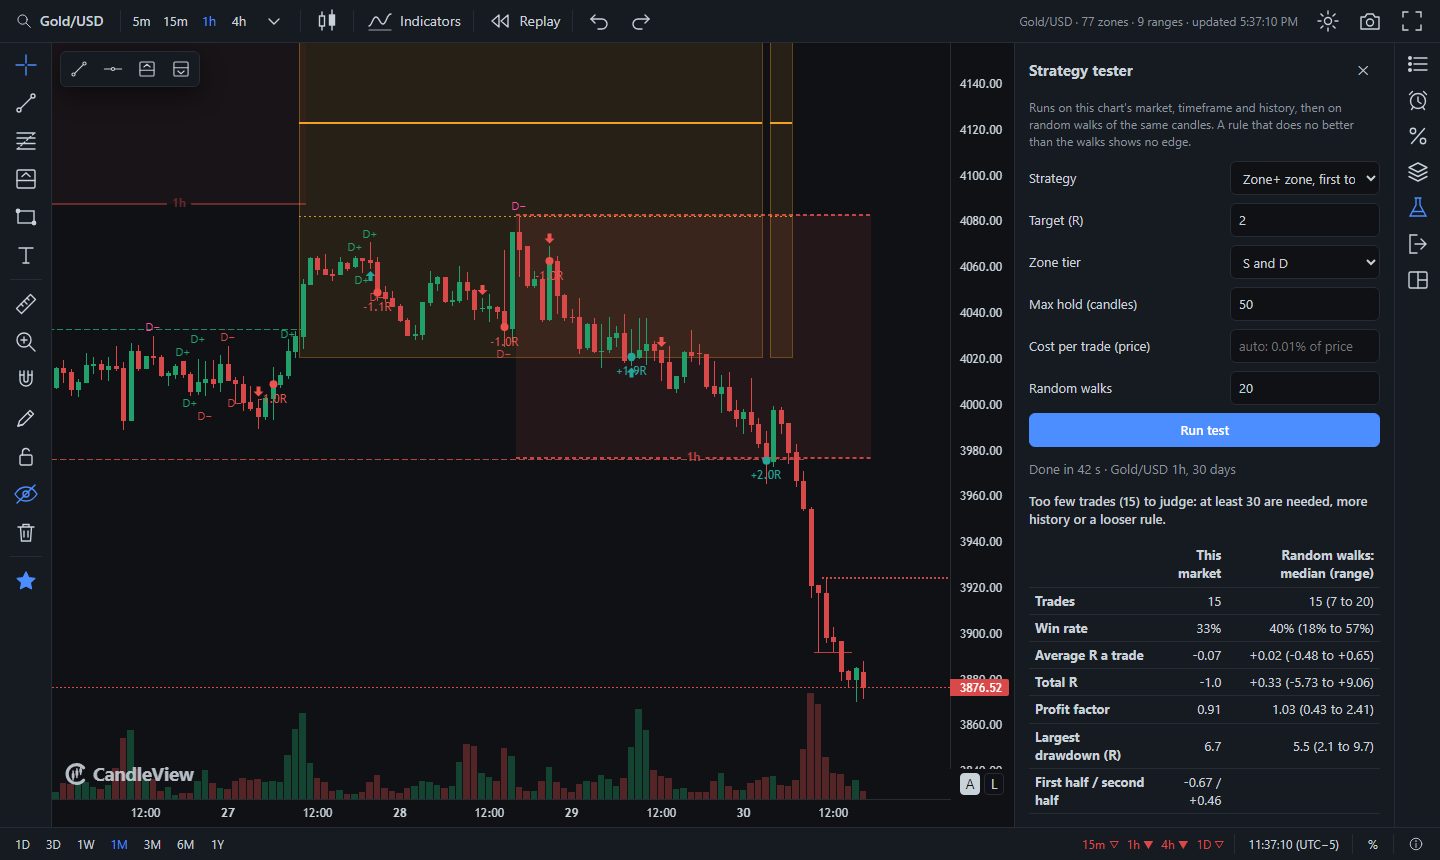
Most backtests show a profit curve and stop there. CandleView checks every result against chance, and when a rule does no better, the tester says so in plain words.
- Breakouts, moving averages and zone entries, costs included
- Every result next to what chance would do
- Too few trades? It says so instead of guessing
Backed by research
Built from research, not sold as signals
Behind the chart are more than 280 logged research observations. Most ideas did not survive them, and the chart only keeps what earns its place. How the engine reads the market stays ours; what it finds is on your chart.
Tested first
Every layer is studied before it reaches the chart, and a result that does not hold up is reported as a fail.
Less is more
Studies that do not earn their place come off the chart, even ones that took weeks to build. What stays is drawn the same way everywhere, so you can trust the picture quickly.
Honest by construction
Every mark is computed from candles that existed at its moment. Replay, alerts and the live chart read the same engine, so what you practise on is what you trade with.
Where it stands
Live today, and what comes next
- Charts from 1 second to daily, with a year of history
- Smart layers: ranges, structure, zones and fair value
- Replay without repaint, across timeframes
- Push alerts and an honest strategy tester
- Installs on any phone from the browser
- New smart layers, added one at a time as each passes research
- More markets and deeper history
- Risk tools for funded-account rules
Private beta
Request access
CandleView is in private beta. Message us on WhatsApp to request access; we reply with a personal access code. For a partnership or investment, email us.
WhatsApp +234 808 300 0771support.candleview@gmail.com
Already have a code?
Enter the access code we sent you. You stay signed in on this device.
Questions
Is this a signal service?
No. CandleView is a smart chart and research tool. It shows structure and measures rules; you make your own decisions. It never promises profits.
How does CandleView decide what to show?
With its own analytics engine, built from our research. Its rules are ours and stay private. What it shows is read the same way on every market and timeframe, and replay never repaints.
Where do the prices come from?
A live broker feed (Deriv) for forex, metals, stock indices and crypto, with a year of history. Candles can differ slightly from your own broker's, as they do between any two brokers.
Does anything repaint?
In replay, every mark is computed only from candles that existed at that moment. On a live chart, the newest marks settle as the current candle closes, which the chart shows as it happens.
Can I use it on my phone?
Yes. Open CandleView in your phone's browser and add it to your home screen. It works on Android and iPhone, and alerts arrive as push notifications.
Can I share my access code?
Codes are personal. A code that is shared may be replaced, which signs out every device using it.
I want to invest or partner. Who do I talk to?
Email support.candleview@gmail.com and we will set up a walkthrough.